The mainstream media is absolutely giddy that the U.S. unemployment rate has hit a "four-year low" of 7.7 percent. But is unemployment in the United States actually going down? After all, you would think that it should be.
The Obama administration has "borrowed" more than 6 trillion dollars from future generations of Americans, interest rates have been pushed to all-time lows, and the Federal Reserve has been wildly printing more money in a desperate attempt to "stimulate" the economy. So have those efforts been successful?
Well, according to the mainstream media, the U.S. unemployment rate is falling steadily. Headlines all over the nation boldly declared that "236,000 jobs" were added to the economy in February, but what they didn't tell you was that the number of Americans "not in the labor force" rose by 296,000.
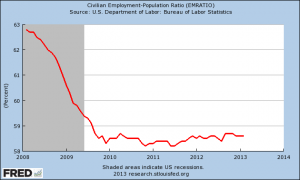
And that is how they are getting the unemployment rate to go down - by pretending that huge numbers of unemployed Americans don't want jobs. Sadly, as you will see below, the truth is that the percentage of working age Americans that have a job is just 0.1% higher than it was exactly three years ago. And we have not even come close to getting back to where we were before the last economic crisis. Read more >>
Showing posts with label Legal working age. Show all posts
Tuesday, March 12, 2013
Friday, May 4, 2012
100 Million Working Age Americans Do Not Have Jobs
| 2009 unemployment numbers |
According to the federal government, there are 12.6 million working age Americans that are considered to be "officially" unemployed, but there are another 87.8 million working age Americans that are not working either. The federal government considers those Americans to be "not in the labor force" so they are not included in the unemployment rate. In fact, this is one of the key ways that the government manipulates the unemployment numbers.
The Obama administration would have us believe that the unemployment rate is going down and that since the start of the last recession about as many Americans have left the labor force as we saw during the entire decades of the 1980s and 1990s combined. The truth is that the percentage of working age Americans that are employed is just about the same right now as it was two years ago. More...
Thursday, May 3, 2012
The 86 Million Invisible Unemployed
As a result, the labor force is now at its smallest size since the 1980s when compared to the broader working age population. A person is counted as part of the labor force if they have a job or have looked for one in the last four weeks. Only about 64% of Americans over the age of 16 currently fall into that category, according to the Labor Department. That's the lowest labor force participation rate since 1984.
It's a worrisome sign for the economy and partly explains why the unemployment rate has been falling recently. Only people looking for work are considered officially unemployed. Last year there were 86 million people who didn't have a job and weren't consistently looking for one, according to Labor Department data. More...
Tuesday, September 13, 2011
Census: US poverty rate swells to nearly 1 in 6
WASHINGTON (AP) -- The Census Bureau reports the number of Americans in poverty jumped to 15.1 percent in 2010, a 27-year high.
About 46.2 million people, or nearly 1 in 6, were in poverty. That's up from 43.6 million, or 14.3 percent, in 2009. It was the highest level since 1983.
The number of people lacking health insurance increased to 49.9 million, a new high after revisions were made to 2009 figures. Losses were due mostly to working-age Americans who lost employer-provided insurance in the weak economy. Main provisions of the health overhaul don't take effect until 2014.
The statistics released Tuesday cover 2010, when U.S. unemployment averaged 9.6 percent, up from 9.3 percent the previous year.
The median -- or midpoint -- household income was $49,445, a 2.3 decline from 2009.
About 46.2 million people, or nearly 1 in 6, were in poverty. That's up from 43.6 million, or 14.3 percent, in 2009. It was the highest level since 1983.
The number of people lacking health insurance increased to 49.9 million, a new high after revisions were made to 2009 figures. Losses were due mostly to working-age Americans who lost employer-provided insurance in the weak economy. Main provisions of the health overhaul don't take effect until 2014.
The statistics released Tuesday cover 2010, when U.S. unemployment averaged 9.6 percent, up from 9.3 percent the previous year.
The median -- or midpoint -- household income was $49,445, a 2.3 decline from 2009.
US poverty rate rose to 15.1% in 2010
The government defines the poverty line as income of $22,314 a year for a family of four and $11,139 for an individual. The Office of Management and Budget updates the poverty line each year to account for inflation.
As for middle-class American families, income fell in 2010. The median household income was $49,445, down slightly from $49,777 the year before.
Overall, median income has changed very little compared to rising consumer prices over the last 30 years. Adjusted for inflation, the middle-income family only earns 11% more than they did in 1980, while consumer prices have risen roughly 155%. More...
Tuesday, April 5, 2011
Percentage of Americans in labor force is the lowest since 1983
theburningplatform.com
Barack Obama and his minions were out in force on Friday declaring that the 216,000 jobs added in February are proof of a recovering economy. The unemployment rate fell to 8.8%, down from 9.8% in April 2010. All it took was 2.8 million Americans to leave the labor force to achieve this fabulous reduction in the unemployment rate. The percentage of Americans in the labor force of 64.2% is the lowest since 1983. The employment to population ratio of 58.5% is also the lowest since 1983. These atrocious figures are after a supposed economic recovery that has been underway for the last 18 months.
There are now 1.8 million more people employed than at the depths of this Greater Depression. The working age population has grown by 3.2 million people since 2009. Inexplicably, the civilian workforce has actually declined by 736,000 over this same time frame. The government drones at the BLS want us to believe these people voluntarily left the workforce. Obama apologists declare this is because Baby Boomers are leaving the workforce as they retire into the sunset. That is laughable, as all studies show Boomers have not saved enough to retire and will be forced to work into their 70′s.
The manipulation of data in order to spin the economic situation in this country in the best light possible has become so blatant that only the most ignorant could possibly believe it. The corporate mainstream media dutifully reports the propaganda, without ever critically assessing what is being distributed by the government. The percentage of the American working population in the workforce consistently ranged between 66% and 67% from 1998 through 2008. Then, suddenly in 2008, after the economy went in the tank, a couple million Americans found better things to do with their spare time and left the workforce. Anyone with an ounce of brains knows these people gave up and are really unemployed. The percentage of people in the labor force should be 66.5%. Using this 20 year average would add 5.5 million people to the civilian labor force and the unemployment rolls. This exercise in reality gives a real unemployment rate of 12%.
It is interesting that Obama and his top economic propagandist Austin Goolsbee were out in full force on Friday, taking credit for the “tremendous” job gains, but had nothing to say earlier in the week with a much more revealing government report. There is now an all-time high of 44.2 million Americans and 20.7 million households in the food stamp program. This is 14.3% of the American population and 18% of all the households. More...
Barack Obama and his minions were out in force on Friday declaring that the 216,000 jobs added in February are proof of a recovering economy. The unemployment rate fell to 8.8%, down from 9.8% in April 2010. All it took was 2.8 million Americans to leave the labor force to achieve this fabulous reduction in the unemployment rate. The percentage of Americans in the labor force of 64.2% is the lowest since 1983. The employment to population ratio of 58.5% is also the lowest since 1983. These atrocious figures are after a supposed economic recovery that has been underway for the last 18 months.
There are now 1.8 million more people employed than at the depths of this Greater Depression. The working age population has grown by 3.2 million people since 2009. Inexplicably, the civilian workforce has actually declined by 736,000 over this same time frame. The government drones at the BLS want us to believe these people voluntarily left the workforce. Obama apologists declare this is because Baby Boomers are leaving the workforce as they retire into the sunset. That is laughable, as all studies show Boomers have not saved enough to retire and will be forced to work into their 70′s.
The manipulation of data in order to spin the economic situation in this country in the best light possible has become so blatant that only the most ignorant could possibly believe it. The corporate mainstream media dutifully reports the propaganda, without ever critically assessing what is being distributed by the government. The percentage of the American working population in the workforce consistently ranged between 66% and 67% from 1998 through 2008. Then, suddenly in 2008, after the economy went in the tank, a couple million Americans found better things to do with their spare time and left the workforce. Anyone with an ounce of brains knows these people gave up and are really unemployed. The percentage of people in the labor force should be 66.5%. Using this 20 year average would add 5.5 million people to the civilian labor force and the unemployment rolls. This exercise in reality gives a real unemployment rate of 12%.
It is interesting that Obama and his top economic propagandist Austin Goolsbee were out in full force on Friday, taking credit for the “tremendous” job gains, but had nothing to say earlier in the week with a much more revealing government report. There is now an all-time high of 44.2 million Americans and 20.7 million households in the food stamp program. This is 14.3% of the American population and 18% of all the households. More...
Subscribe to:
Posts (Atom)